How to Use the Swami Score

At Swami Research, we've developed the Swami Score, a unique and powerful tool that helps investors and advisors make smarter, more informed decisions in increasingly unpredictable markets. Whether you're managing your personal portfolio or advising others, the Swami Score offers clear, data-driven insights to help you allocate capital wisely.
In today's markets, volatility events are happening more frequently than ever. From sudden macroeconomic shifts to rapid changes in global sentiment, relying solely on traditional tools like simple moving averages or sensationalist stock headlines can be risky, even harmful. The Swami Score cuts through the noise, providing an objective view of an asset’s momentum that helps you navigate both calm and stormy market conditions.
What is the Swami Score?
The Swami Score is a numerical value that ranges from -100 to +100, reflecting the overall strength of an asset’s signal.
The score is calculated using a blend of price action, volatility, and trading volume to deliver a comprehensive market signal.
Here’s a quick guide:
- Higher Swami Score (Closer to +100): The asset is showing stronger bullish momentum. Allocate more capital toward assets with higher scores.
- Neutral Swami Score (-10 to +10): The market is balanced, with no strong signals. Wait and watch for clearer trends.
- Lower Swami Score (Closer to -100): The asset is showing stronger bearish momentum. Allocate less capital or move away from assets with lower scores.
Reducing Drawdown Risk with the Swami Score
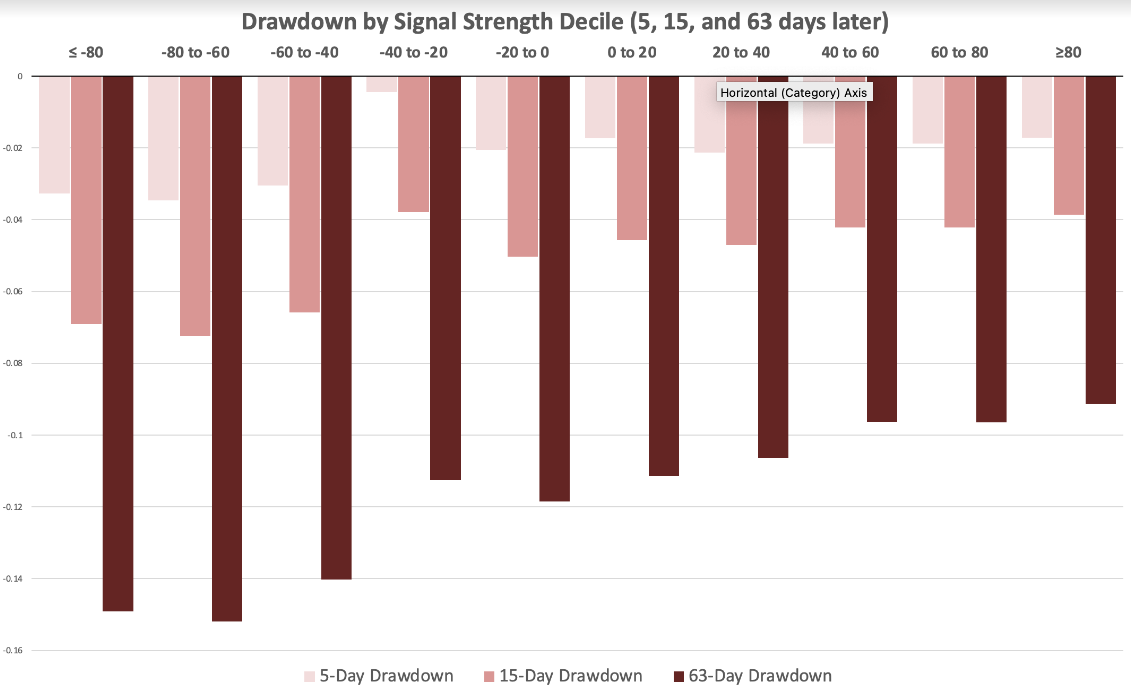
One of the biggest advantages of using the Swami Score is its ability to help you avoid significant drawdowns—those painful declines in your portfolio that can take years to recover from. By staying in assets with higher scores and exiting or avoiding those with lower scores, you can reduce your exposure to large losses.
In fact, our data shows that focusing on assets with stronger Swami Scores significantly decreases drawdown risk over time, while improving your chances of staying in sync with the market’s real-time movements.
Correlation Between Positive Returns and Swami Scores
Another benefit of the Swami Score is its strong correlation with positive returns. The following chart shows the relationship between Swami Scores and Year-to-Date (YTD) returns:
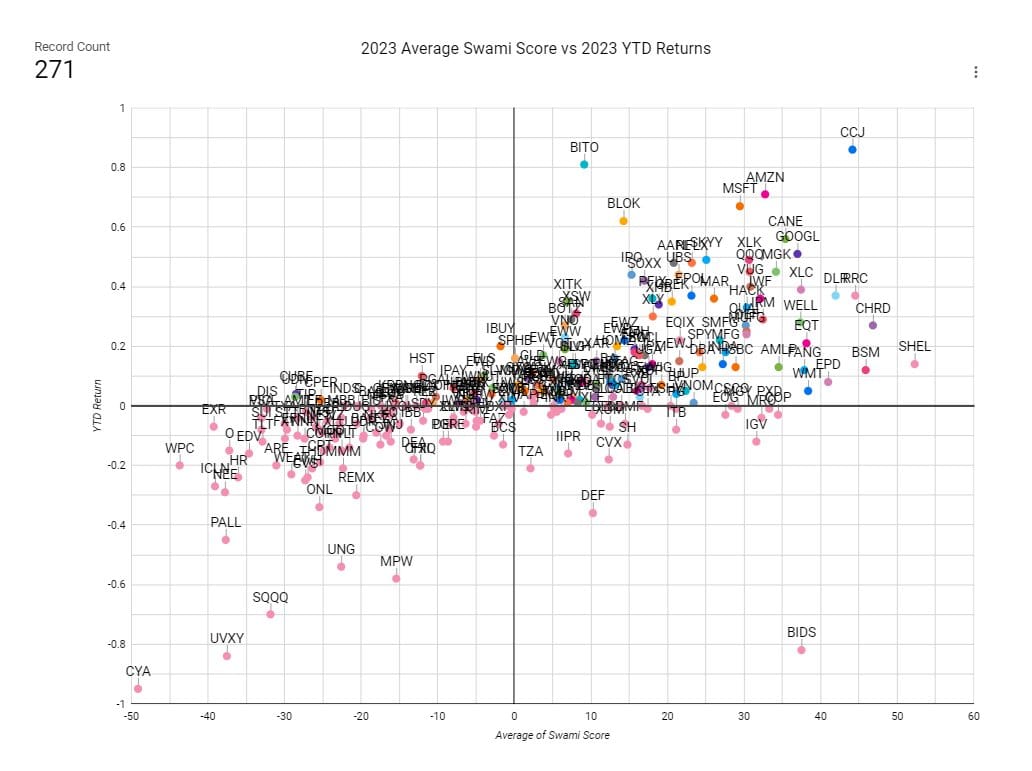
This chart clearly illustrates that assets with higher Swami Scores tend to have higher returns. Conversely, assets with negative Swami Scores often result in lower or negative returns. This correlation helps investors focus on the assets with the most promising outlooks while avoiding those that are likely to underperform
Final Thoughts
The Swami Score is designed to help you navigate today’s complex and volatile markets with confidence. By using this data-driven tool, you can sidestep the emotional pitfalls of investing and stay focused on what the market is telling you in real time.
Gone are the days when you could simply rely on traditional moving averages or eye-catching stock headlines. Today, success comes from anticipating changes in the market—before they happen. The Swami Score is your guide to doing just that.
For more insights, check out our videos on How to Use Swami Score and Levels and Practical Fractals with Joe Catanzaro, or subscribe to our service for daily and weekly reports that will keep you ahead of the curve.